

Applying #MachineLearning to single-cell data can seem daunting - so i've started a video series to help people get going. Starting with a Random Forest classifier, I give several #Python examples for predicting cell states: youtu.be/3Q9R2mv6GO0 #bioinformatics

3 key reviews to get you started with spatial transcriptomics:

Made a simple introduction video for those trying to dip their feet in spatial-seq data analysis. I use scanpy, which requires some proficiency in Python. I focus on @10xGenomics Visium, but info is translatable to others. #Bioinformatics youtu.be/86uR01mwLIQ
In response to questions & comments by @hippopedoid, @adamgayoso, @akshaykagrawal et al. on "The Specious Art of Single-Cell Genomics", Tara Chari & I have posted an update with some new results. Tl;dr: definitely time to stop making t-SNE & UMAP plots.🧵biorxiv.org/content/10.110…
There's a new preprint calling to stop using UMAP, t-SNE et al, calling them arbitrary "Specious Art", which I disagree with. It's getting a lot of attention, and I think I have an idea why.
I am late to the party (was on holidays), but have now read @lpachter's "Specious Art" paper as well as ~300 quote tweets/threads, played with the code, and can add my two cents. Spoiler: I disagree with their conclusions. Some claims re t-SNE/UMAP are misleading. Thread. 🐘 pic.twitter.com/Ky9QRmXoyS twitter.com/lpachter/statu…
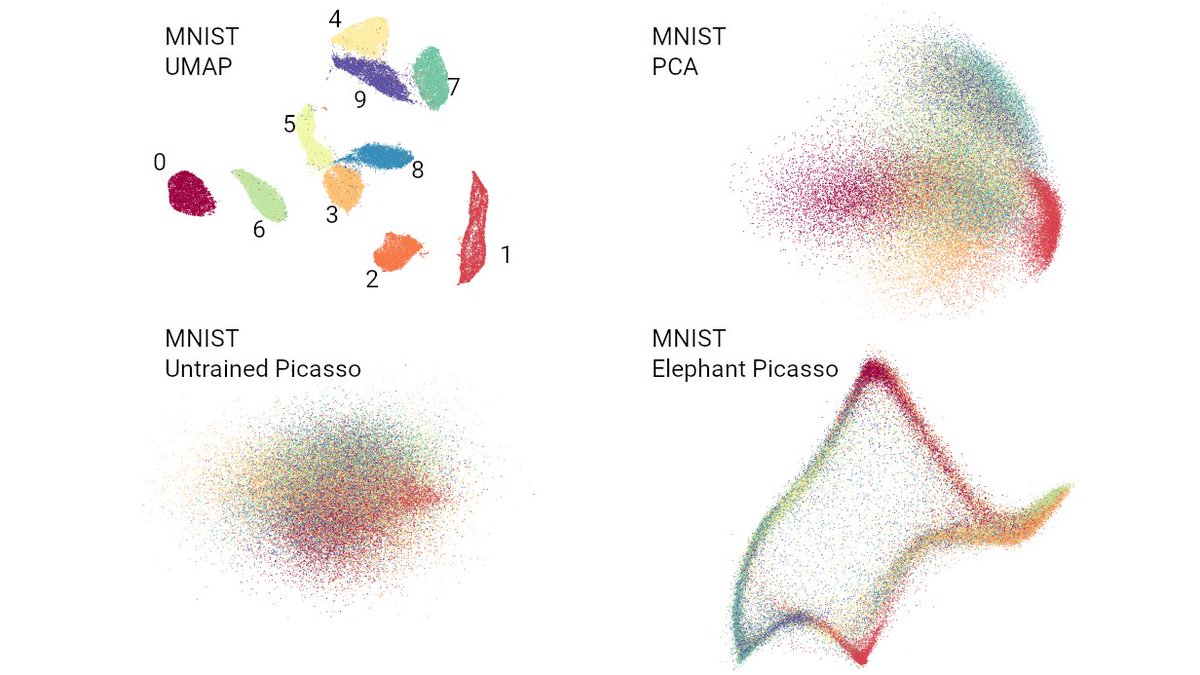
It's time to stop making t-SNE & UMAP plots. In a new preprint w/ Tara Chari we show that while they display some correlation with the underlying high-dimension data, they don't preserve local or global structure & are misleading. They're also arbitrary.🧵biorxiv.org/content/10.110… pic.twitter.com/dmFzD5RR6R
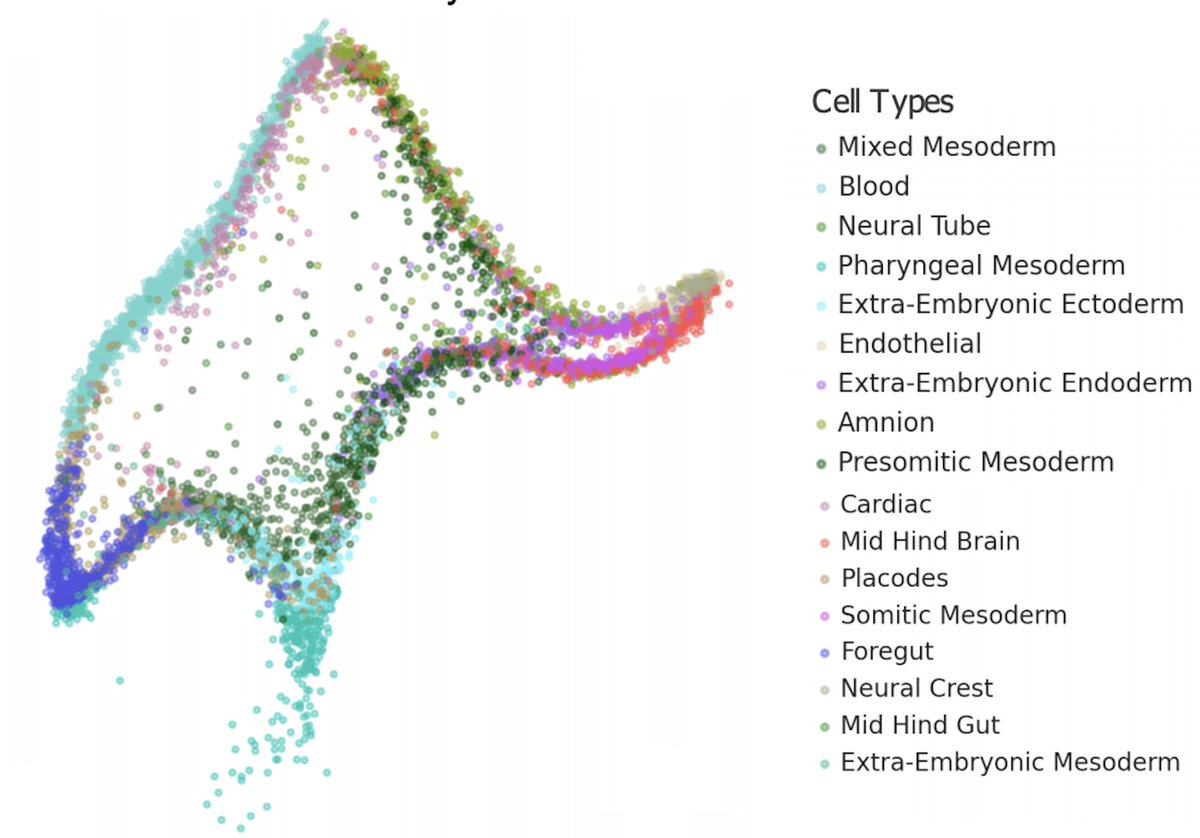
new preprint, a collaboration with @EricJDeeds, @ShamusCooley84, and @Timothy54253493. Goal: find the true dimensionality of a cell using single cell RNA-Seq. TL;DR: dimensionality reduction distorts >95% of local structure, calling into question many scRNA-Seq analyses. 1/17
what are the current methods to determine the optimal number of clusters from a single-cell RNAseq dataset?

Introducing {ggrandom} 📦 Randomly use ggplot2 themes and color scales 🎲 Set `chaos = TRUE` to break reproducibility by "ignoring" the seed 🌱 github.com/EmilHvitfeldt/… #rstats #ggplot2 pic.twitter.com/616YUXDYuq

I reviewed 100+ conference abstracts over the weekend. A 🧵 with some of my takeaways on how to craft an excellent abstract: 1/12

Tweetorial / remarks about our mega ocular single cell "scEiaD" resource: biorxiv.org/content/10.110……, github.com/davemcg/scEiaD. In June 2019 I simultaneously decided that I would go Genome Informatics 2019 and It was time to make the single-cell update to eyeIntegration.nei.nih.gov

- Tweetorial on scEiaD (eye in a dish)
- They used scarches to integrate LOADS of datasets and have a google colab notebook of it all
- Also metrics for assessing integration and methods for scarches hyperparameter optimisation

I am often asked why I insist on complicating a plot by overlaying a violin plot on top of a box plot when the latter already gives a good visual summary of the distribution. This gif provides a reason. For a more nuanced argument, see: autodesk.com/research/publi… #rstats #dataviz pic.twitter.com/Qk1lQMuBJm
- Nice gif to demonstrate why you need to overlay a violin plot on top of boxplot

If I see someone starting to learn the #tidyverse, one of the first resources I recommend them while learning "tidy" verbs is @grrrck's `tidyexplain`! 💕 garrickadenbuie.com/project/tidyex… I wish there were more visual explanations like this when I was learning R. #rstats #DataScience pic.twitter.com/XH63sBYjPL
- Animation of gather/spread

Check out this cool animation @alvinwendt made of the list of preattentive attributes shown in Chapter 1 of #BetterDataVisualizations. Thanks, Alvin! pic.twitter.com/Zp3iC0IrBO
- Nice illustration of Gestalt theory